Polls are a staple of election season, whether they’re asking who your preferred party or leader is, a lot of election coverage will include polls to gauge public opinion.
What’s a poll? Sometimes also called an ‘opinion poll’ it’s essentially a survey of a group of people to find out what they think about election-related issues. This could be to find out what local issues are important to them, how they view the government, opposition or parties or which candidates they’re likely to vote for.
Of course we’ve only just had a state election in SA, so we’ve seen a lot of Liberal vs Labor and Marshall vs Malinauskas polls in the last few months. But now that the federal election has been called and we have well and truly shifted our focus to it, polling numbers have been making more headlines over the past few weeks. Most memorably the below graphic from The Australian was widely circulated, not for the results, but the representation of them.
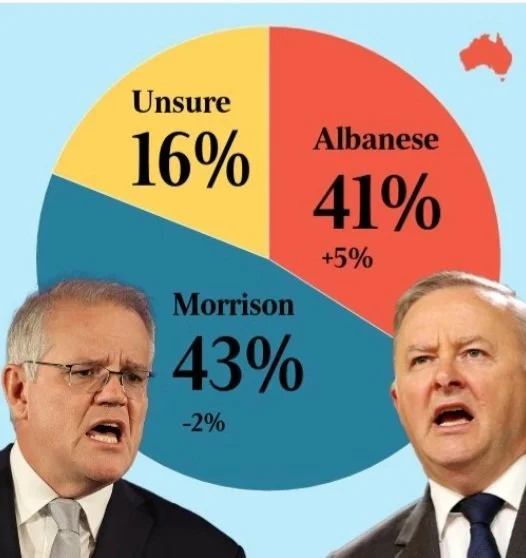
It’s not shocking that this made waves, one of the largest media outlets in the country somehow cleared this to be published. Twitter and other social media platforms blew up, confused by how 41% could possibly be so much smaller than 43%.
But unequal pie charts aside, should we give polls any real weight?
The answer is yes and no.
Polls can be a good way to get a picture of public opinion, particularly because media attention doesn’t always reflect the views of the public.
But it’s important to remember they will always have a margin of error, which is generally around 3%. All that means is that if 52% of people polled responded to one option the real figure is anywhere from 49 – 55%.
It’s a consideration we have to make for whoever is polling lower too. 48% with a 3% margin of error means the real figure could be anywhere from 51-45%, and while that’s still a lower range than their hypothetical opponent, there’s a lot of overlap and it isn’t really enough to make a concrete call on an election.
Because of this, changes or ‘swings’ of a few per cent probably don’t measure up to any real change in public opinion. The 2019 federal election is a perfect example of this. Polls were reporting 52-48 and 51-49 in favour of Labor calling it an election they couldn’t lose and, as it turns out, that wasn’t the case.
The media will report on almost any change now that we’re really in election mode, so we’re left to look past the headlines. Is every reported ‘shocking’ poll result going to be as surprising or as important as it claims? It’s unlikely, so our attention is better directed toward the actual numbers, rather than the sensationalised headlines.
While polling isn’t an exact science, data collected over months and years can illustrate trends in public opinion. Rather than just looking at the most recent results or disregarding them all together, direct your attention to any trends they may highlight.
One set of polling numbers on their own really don’t tell us much, but we can look at where they sit in comparison to past polls. Is one party’s number going up over time? Are the polls coming back around the same each time? The more data we can look at and the more media news we can cut through the better.
